

When it comes to security, organizations often consider themselves well-covered. But in today’s landscape, where cybersecurity threats evolve at breakneck speed, even the most well-prepared teams cannot afford to have testing gaps.
The reality is that if your primary strategy for removing security testing gaps is tightening scanning policies or expanding penetration test scope, you are trying to patch a dam with bubble gum.
Is your attack surface covered? Let’s take a deeper look at the reality behind security testing and how common approaches may leave you with larger gaps than you expect.
The Math of Security Gaps
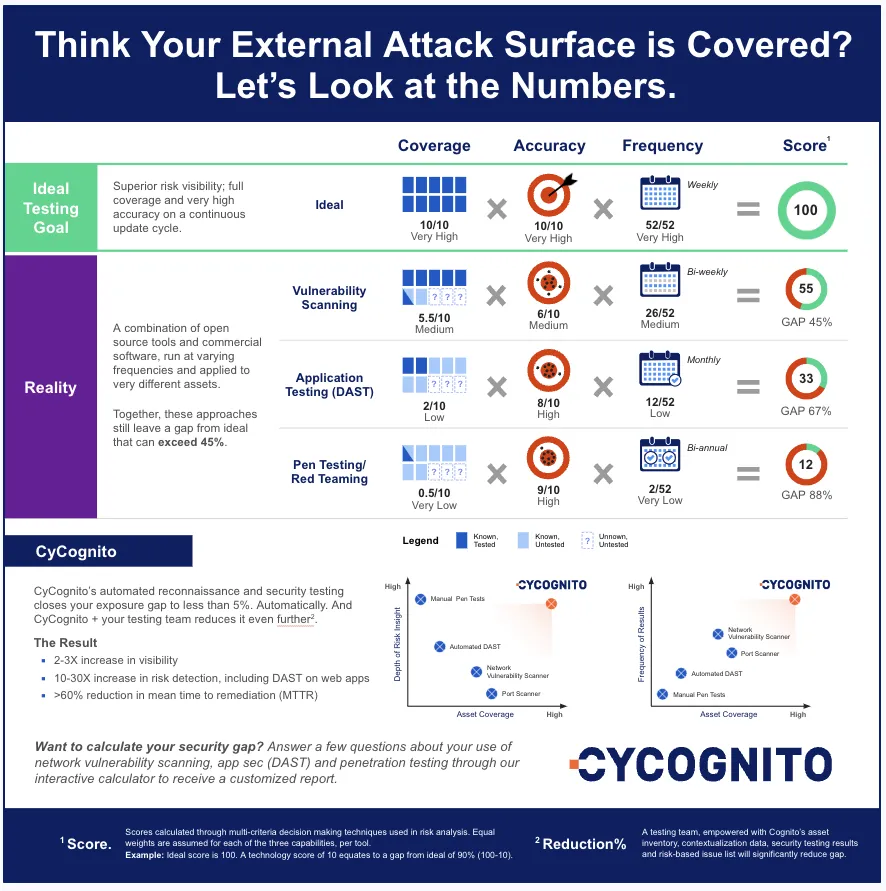
To calculate security testing gaps we need a risk model and relevant test criteria. Multi-criteria decision analysis (MCDA) is a great fit. For security testing criteria, we’ll use coverage, accuracy, and frequency.
Why these criteria? Security testing gaps are not just about coverage. Gaps in test frequency and test accuracy are just as problematic.
What Does “Ideal” Security Testing Look Like?
We all know there’s no standard when it comes to security testing. Each organization must tailor its strategy to its unique business needs, risks, skills and budgets.
While this means the concept of ideal is subjective, the following are agreed upon truths:
- Test Everything: It’s not enough to just test what you know about or what you think is most visible – everything exposed must be tested.
- Test Accurately: High accuracy means less noise and deeper, more meaningful results. With fewer false positives, your team can focus on actual vulnerabilities rather than chasing false alarms.
- Test Frequently: Your test cadence may be dictated by compliance and also your team’s capacity to respond. Weekly tests is considered an ideal target.
So, let's put a stake in the ground. “Ideal” testing is full coverage, very high accuracy, and very high frequency. Combined, these should result in a perfect score of 100 and a gap of 0%.

For those of you double-checking the math, note that while the graphic shows basic multiplication, the actual MCDA model is more sophisticated. This graphic is for visualization only. Reach out if you would like to discuss the model (or use our calculator at the end of this blog to determine your own gaps!).
Calculating the Actual Security Testing Score
On average, companies deploy 53 security tools across their environments. These tools include a mix of commercial and open-source testing solutions, running at varying frequencies across different assets.
Many of these tools are not designed for the coverage, accuracy, or frequency required for ideal security testing. Stretching these tools beyond their capabilities in order to maximize budget leaves staff with more work, less value and a false sense of security.
Let’s look closer at three common test approaches: network vulnerability scanning, application testing (DAST), and penetration testing.
1. Network Vulnerability Scanning
Network scanners scan known subnets for vulnerabilities and misconfigurations on exposed systems and services. Here is a realistic deployment:
- Coverage: Medium to high (70 to 80% of known assets).
- Accuracy: Medium. Vulnerability scanners are well-known for producing false positives since they often rely solely on passive scanning techniques, CPE to CVE mappings and unvalidated results.
- Frequency: Ranges from weekly to monthly on average; let’s call it bi-weekly for this example.
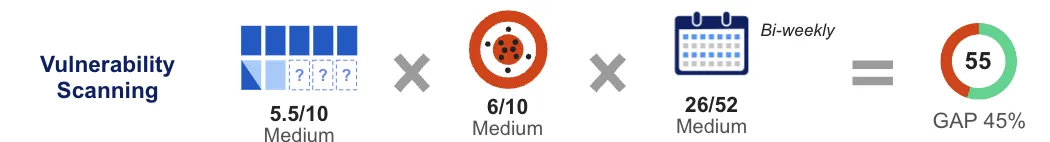
The result is a score of 55, which is a 45% gap from ideal. Probably bigger than you thought. And even if you increase scanning frequency to weekly, you’re still left with a 35% gap.
2. Application Testing (DAST)
Dynamic Application Security Testing (DAST) is a form of black-box testing for web applications. Here is a realistic deployment:
- Coverage: Low (20% or less of known web applications). This is usually due to labor and license costs, coupled with long test management time and risk of impact.
- Accuracy: High. DAST tools have built-in success criteria, which lowers false positives and validates more complex issues.
- Frequency: Low. Ranges depending on size of attack surface, but in general monthly is considered best case (see our 2024 State of Web Application Security Testing report for more info).
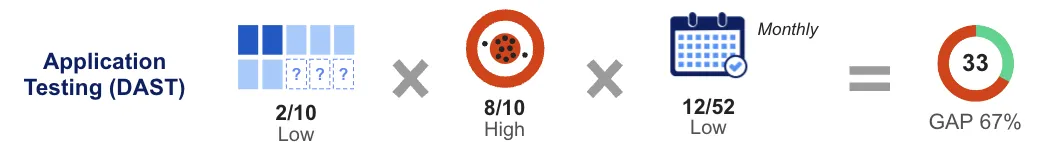
The result is a score of 33, which is a gap of 67% from ideal. While DAST tools offer high accuracy, its coverage and accuracy pull it down. This is a major testing gap, despite web applications being one of the largest threat vectors.
3. Penetration Testing
Legacy penetration testing is a manual offensive security exercise that includes scoping, reconnaissance, vulnerability scanning, and testing. Here is a realistic use case:
- Coverage: Low (5 to 10%, focused only on high-value assets). High labor costs and long test times make it difficult to scale to even a large fraction of full coverage.
- Accuracy: High. Pen testing involves human verification, which brings a higher level of expertise and curiosity to the process.
- Frequency: Low (typically annually or twice a year).
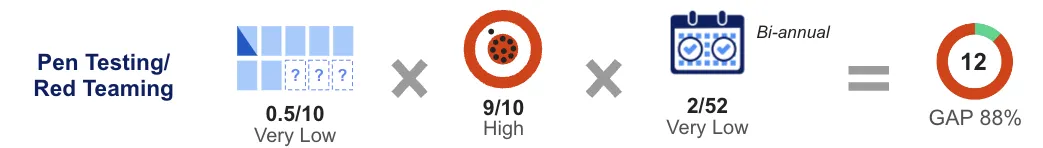
The result is a score of 12, which equates to a considerable gap of 88% from ideal. Pen testing is highly valuable and can be highly accurate, but with coverage and frequency so low it is hard to have it move the needle on real-time risk.
Should You Be Satisfied with 45%?
Is it a surprise that the three examples have a best case scenario 45% gap from ideal? If you are like many, this number is large enough that you are comparing it to your own deployments.
You can relax (a bit) since this is a high-level exercise, not a multi-month onsite audit of your InfoSec department. For example, your compensating controls reduce the risk from testing gaps (e.g., a WAF in front of an untested web app), and isn’t part of this measurement.
But that doesn’t mean the gaps aren’t real. Protection-based security tools are important, but resolving an issue before it becomes an incident (or a breach) eliminates the associated emergency overnight patching panic.
Take a look at your current testing technologies through the lens of coverage, accuracy and frequency. How do they compare to ideal, and what do you feel it would take to bring it there?
Remove Your Security Testing Gaps in One Step
“CyCognito provides a true platform that cuts across multiple market categories. It gives us greater visibility to our attack surface than other solutions we’ve used and the type of risk assessment depth that normally requires an expert pen tester.”
CISO, Publicly traded global investment management firm
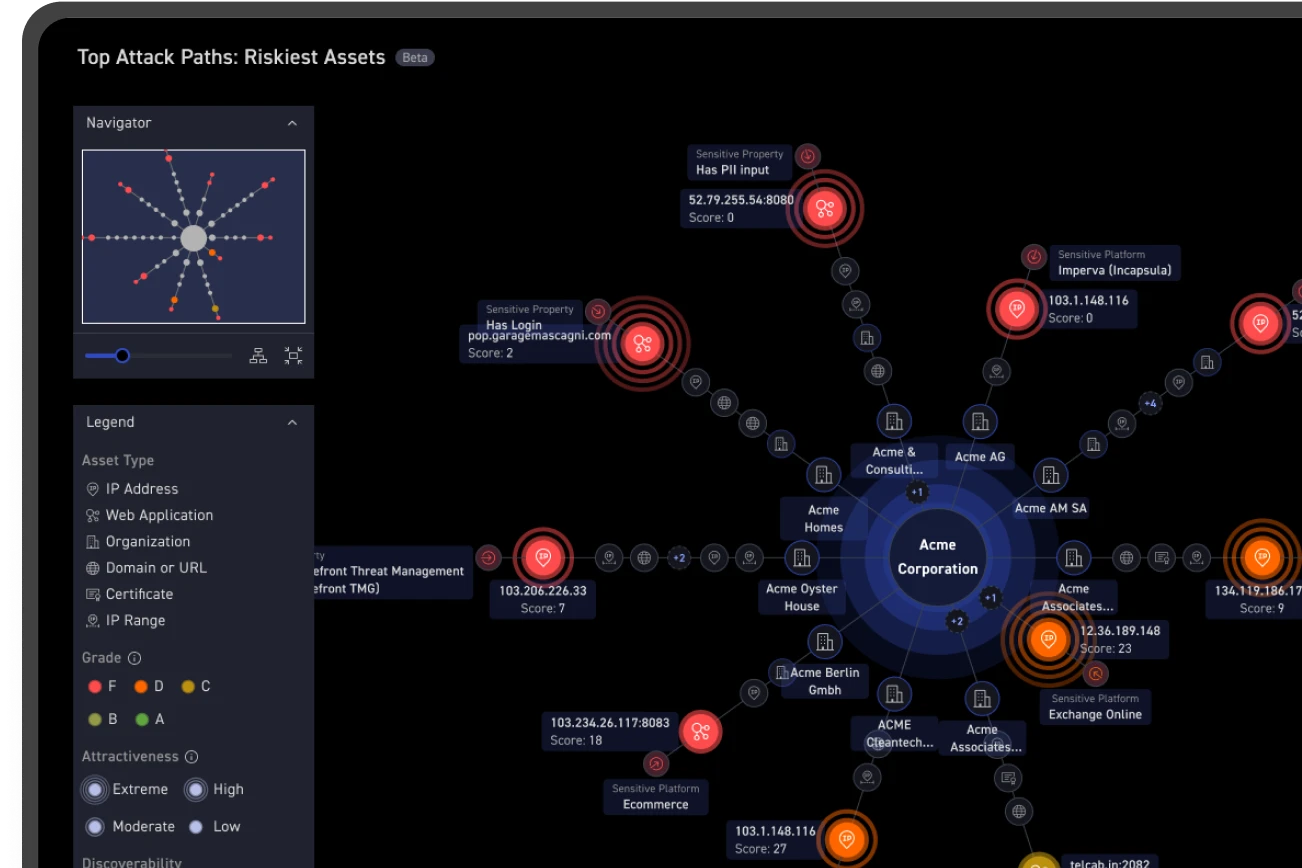
CyCognito is an automated testing solution with integrated recon, discovery and prioritization. Designed from the ground up to remove the complexity of security testing, CyCognito provides a single interface for safe testing of both network systems and web applications.
With CyCognito, your teams know:
- All exposed assets are continuously identified, validated and actively tested – including web apps using DAST.
- New business structures and related exposed assets will be added automatically, without manually entered seed information or prompts.
- Attacker interest in the vulnerability, through integrated threat intelligence, including CISA known exploited vulnerabilities (KEV).
- Remediation planning workflows with steps to reach your desired security grade
- Issues that are in violation six cybersecurity frameworks (including ISO, NIST and CIS).
CyCognito provides:
- Issues that represent true risk to your organization.
- Validation that an issue was remediated.
- Detailed risk grading and scoring per asset, per subsidiary and per brand, with evidence
- Remediation instructions and an estimate of remediation effort.
- Complex recon such as asset business function, business owner and asset location details (for example autonomous system number, or ASN) that is proven to reduce your mean time to remediation (MTTR).
With CyCognito, you can reach a security testing score of 95+, with no installation, configuration, or management challenges.
Curious about your security testing gap? Answer a few questions in the CyCognito Security Testing Gap Calculator to receive a custom report that includes individual test scores, gaps, and customized insight as to how to improve your score.